 Catalogue PIGMA
Chlorophyll pigment concentrations in water bodies
Type of resources
Available actions
Topics
Keywords
Contact for the resource
Provided by
Years
Formats
Representation types
Update frequencies
status
Scale
Resolution
-

SYKE Alg@line project in the Baltic Sea monitors the state of the sea and detects algal blooms. Several millions of data points are collected annually from the Baltic Sea, using a fleet of 5-7 ferries. Two best equipped ferries offered in TNA are m/s Silja Serenade, which travels daily between Helsinki and Stockholm (Sweden) and m/s Finnmaid, which travels approx. twice a week from Helsinki to Travemünde (Germany) and back. Both ferries are equipped with flow-through system with thermosalinograph, chlorohyll, phycocyanin and CDOM fluorometers, turbiditymeter and refrigerated sampling unit providing discrete water samples for laboratory analyses (e.g. microscopy, flowCAM, nutrients, optical analysis, experimental work). Additional sensors e.g. for primary production (FRRF) and light reflectance are used periodically, new sensors for light absorption and pCO2 will be soon implemented. Data can be retrieved in real time using satellite or GSM connection (basic sensors) or downloaded during harbour visits (additional sensors). Alg@line data is available e.g. through MyOcean and has also been delivered to users based on mutual cooperation, including scientific advice. Algaline ships maintained by SYKE host measurement systems from other countries, and periodically they are used as platforms for international short-term studies.
-

SYKE Alg@line project in the Baltic Sea monitors the state of the sea and detects algal blooms. Several millions of data points are collected annually from the Baltic Sea, using a fleet of 5-7 ferries. Two best equipped ferries offered in TNA are m/s Silja Serenade, which travels daily between Helsinki and Stockholm (Sweden) and m/s Finnmaid, which travels approx. twice a week from Helsinki to Travemünde (Germany) and back. Both ferries are equipped with flow-through system with thermosalinograph, chlorohyll, phycocyanin and CDOM fluorometers, turbiditymeter and refrigerated.sampling unit providing discrete water samples for laboratory analyses (e.g. microscopy, flowCAM, nutrients, optical analysis, experimental work). Additional sensors e.g. for primary production (FRRF) and light reflectance are used periodically, new sensors for light absorption and pCO2 will be soon implemented. Data can be retrieved in real time using satellite or GSM connection (basic sensors) or downloaded during harbour visits (additional sensors). Alg@line data is available e.g. through MyOcean and has also been delivered to users based on mutual cooperation, including scientific advice. Algaline ships maintained by SYKE host measurement systems from other countries, and periodically they are used as platforms for international short-term studies.
-
This tool will visualise data collected during surveys and research cruises with the RV Cefas Endeavour focusing on chlorophyll a and phytoplankton functional types. It will make the link between the in-situ measurement and the Earth Observation and modelling and will develop the combined data set approach for the descriptors 1, 4, and 5 for MSFD. Primarily, developed in R shiny, with a tab for exploring each dataset, and a front page where datasets can be visualised concurrently, the tool will propose products using the outputs from the different approaches and will be included in the products and services Cefas portfolio.
-
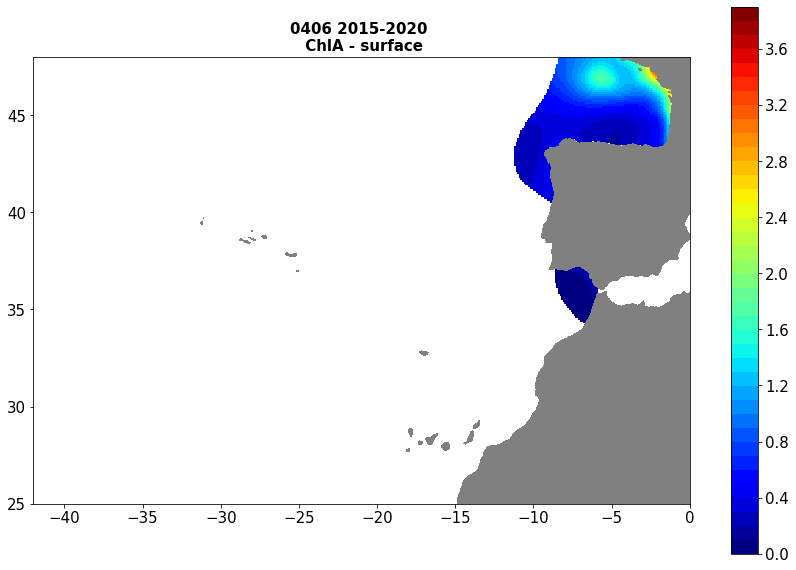
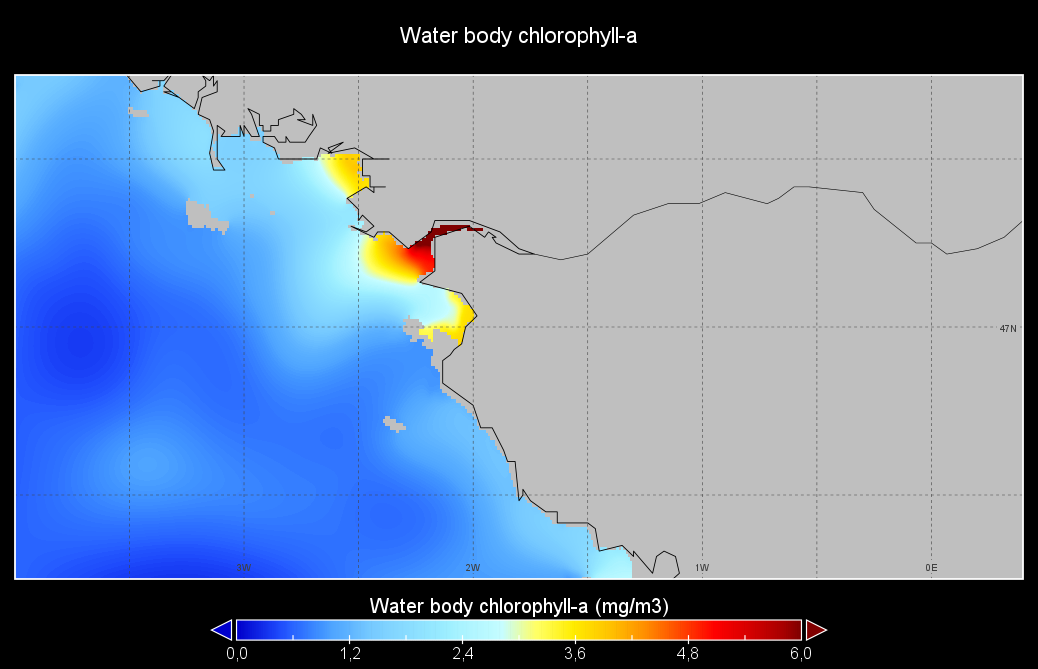
Moving 6-year analysis of Chlorophyll-a at Atlantic Sea for each season. - winter: January-March, - spring: April-June, - summer: July-September, - autumn: October-December Every year of the time dimension corresponds to the 6-year centred average of each season. 6-year periods span from 1972-1977 until 2012-2020. Observational data span from 1972 to 2020. Depth range (IODE standard depths): -300.0, -250.0, -200.0, -150.0, -125.0, -100.0, -75.0, -50.0,-40.0, -30.0, -20.0, -10.0, -5.0, -0.0 Data Sources: observational data from SeaDataNet/EMODNet Chemistry Data Network. Description of DIVA analysis: Geostatistical data analysis by DIVA (Data-Interpolating Variational Analysis) tool. GEBCO 1min topography is used for the contouring preparation. Analyzed filed masked using relative error threshold 0.3 and 0.5 DIVA settings. Correlation length was optimized and filtered vertically and a seasonally-averaged profile was used. Signal to noise ratio was fixed to 1. Logarithmic transformation applied to the data prior to the analysis. Background field: the data mean value is subtracted from the data. Detrending of data: no, Advection constraint applied: no. Units: mg/m^3
-
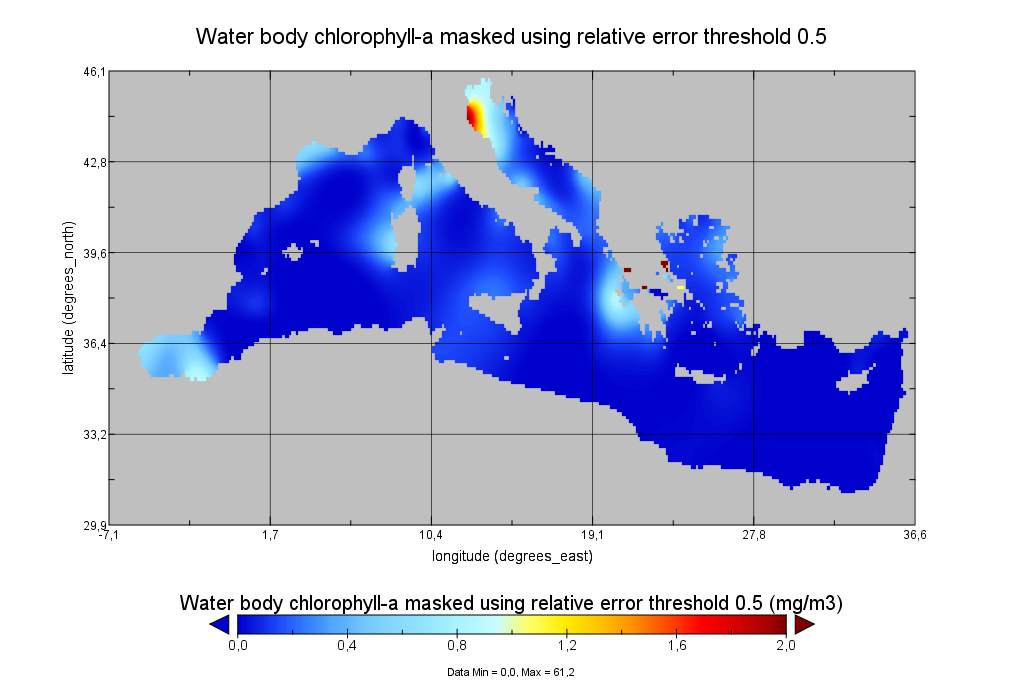
Moving 6-year analysis of Water_body_chlorophyll-a in the Mediterranean Sea for each season: - winter: January-March, - spring: April-June, - summer: July-September, - autumn: October-December. Every year of the time dimension corresponds to the 6-year centered average of the season. 6-years periods span from 1990-1995 until 2014-2019. Observational data span from 1970 to 2019. Depth range (IODE standard depths): -1000.0, -900.0, -800.0, -700.0, -600.0, -500.0, -400.0, -300.0, -250.0, -200.0, -150.0, -125.0, -100.0, -75.0, -50.0, -30.0, -20.0, -10.0, -5.0, -0.0. Data Sources: observational data from SeaDataNet/EMODnet Chemistry Data Network. Description of DIVA analysis: Geostatistical data analysis by DIVA (Data-Interpolating Variational Analysis) tool. Profiles were interpolated at standard depths using weighted parabolic interpolation algorithm (Reiniger and Ross, 1968). GEBCO 1min topography is used for the contouring preparation. Analysed filed masked using relative error threshold 0.3 and 0.5. DIVA settings: A constant value for signal-to-noise ratio was used equal to 1. Correlation length was optimized and filtered vertically and a seasonally-averaged profile was used. 'log(data)-exp(analysis' transformation applied to the data prior to the analysis. Background field: the data mean value is subtracted from the data. Detrending of data: no. Advection constraint applied: no. Units: mg/m^3. The entire set of related maps can be found in the viewing service: https://emodnet.ec.europa.eu/geoviewer/. Originators of Italian data sets-List of contributors: - Brunetti Fabio (OGS) - Cardin Vanessa, Bensi Manuel doi:10.6092/36728450-4296-4e6a-967d-d5b6da55f306 - Cardin Vanessa, Bensi Manuel, Ursella Laura, Siena Giuseppe doi:10.6092/f8e6d18e-f877-4aa5-a983-a03b06ccb987 - Cataletto Bruno (OGS) - Cinzia Comici Cinzia (OGS) - Civitarese Giuseppe (OGS) - DeVittor Cinzia (OGS) - Giani Michele (OGS) - Kovacevic Vedrana (OGS) - Mosetti Renzo (OGS) - Solidoro C.,Beran A.,Cataletto B.,Celussi M.,Cibic T.,Comici C.,Del Negro P.,De Vittor C.,Minocci M.,Monti M.,Fabbro C.,Falconi C.,Franzo A.,Libralato S.,Lipizer M.,Negussanti J.S.,Russel H.,Valli G., doi:10.6092/e5518899-b914-43b0-8139-023718aa63f5 - Celio Massimo (ARPA FVG) - Malaguti Antonella (ENEA) - Fonda Umani Serena (UNITS) - Bignami Francesco (ISAC/CNR) - Boldrini Alfredo (ISMAR/CNR) - Marini Mauro (ISMAR/CNR) - Miserocchi Stefano (ISMAR/CNR) - Zaccone Renata (IAMC/CNR) - Lavezza, R., Dubroca, L. F. C., Ludicone, D., Kress, N., Herut, B., Civitarese, G., Cruzado, A., Lefèvre, D., Souvermezoglou, E., Yilmaz, A., Tugrul, S., and Ribera d'Alcala, M.: Compilation of quality controlled nutrient profiles from the Mediterranean Sea, doi:10.1594/PANGAEA.771907, 2011.
-
Moving 6-year analysis and visualization of Water body chlorophyll-a in the North Sea. Four seasons (December-February, March-May, June-August, September-November). Data Sources: observational data from SeaDataNet/EMODnet Chemistry Data Network. Description of DIVA analysis: Geostatistical data analysis by DIVAnd (Data-Interpolating Variational Analysis) tool, version 2.7.9. results were subjected to the minfield option in DIVAnd to avoid negative/underestimated values in the interpolated results; error threshold masks L1 (0.3) and L2 (0.5) are included as well as the unmasked field. The depth dimension allows visualizing the gridded field at various depths.
-
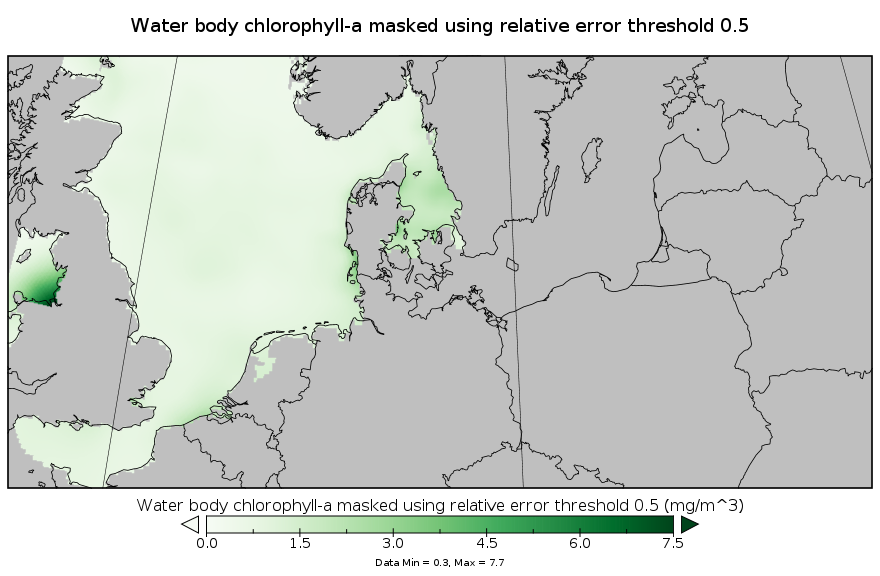
This gridded product visualizes 1960 - 2014 water body chlorophyll-a (mg/m^3) in the North Sea domain, for each season (winter: December – February; spring: March – May; summer: June – August; autumn: September – November). It is produced as a Diva 4D analysis, version 4.6.11: a reference field of all seasonal data between 1960-2014 was used; results were logit transformed to avoid negative/underestimated values in the interpolated results; error threshold masks L1 (0.3) and L2 (0.5) are included as well as the unmasked field. Every step of the time dimension corresponds to a 10-year moving average for each season. The depth dimension allows visualizing the gridded field at various depths.
-
Seasonal climatology of Water body chlorophyll-a for Loire river for the period 1971-2021 and for the following seasons: - winter: January-March, - spring: April-June, - summer: July-September, - autumn: October-December. Observation data span from 1971 to 2021. Depth levels (m): [0.0, 2.0, 4.0, 6.0, 8.0, 10.0, 15.0, 20.0, 25.0, 30.0, 35.0, 40.0, 45.0, 50.0, 60.0, 70.0, 80.0, 90.0, 100.0, 110.0, 120.0, 130.0]. Data sources: observational data from SeaDataNet/EMODNet Chemistry Data Network. Description of DIVAnd analysis: the computation was done with DIVAnd (Data-Interpolating Variational Analysis in n dimensions), version 2.7.4, using GEBCO 15 sec topography for the spatial connectivity of water masses. The horizontal resolution of the produced DIVAnd maps is 0.01 degrees. Horizontal correlation length is defined seasonally (in meters): 14000 (winter), 52000 (spring), 42000 (summer), 125000 (autumn). Vertical correlation length was optimized and vertically filtered and a seasonally-averaged profile was used (DIVAnd.fitvertlen). Signal-to-noise ratio was fixed to 1 for vertical profiles and 0.1 for time series to account for the redundancy in the time series observations. A logarithmic transformation (DIVAnd.Anam.loglin) was applied to the data prior to the analysis to avoid unrealistic negative values. Background field: the vertically-filtered data mean profile is substracted from the data. Detrending of data: no, advection constraint applied: no. Units: mg/m3.
-
Moving 6-year analysis of Water body chlorophyll-a in the Mediterranean Sea for each season: - winter: January-March, - spring: April-June, - summer: July-September, - autumn: October-December. Every year of the time dimension corresponds to the 6-year centered average of the season. 6-years periods span from 1990-1995 until 2016-2021. Data Sources: observational data from SeaDataNet/EMODNet Chemistry Data Network. Units: mg/m3. Description of DIVA analysis: The computation was done with the DIVAnd (Data-Interpolating Variational Analysis in n dimensions), version 2.7.9, using GEBCO 30sec topography for the spatial connectivity of water masses. The horizontal resolution of the produced DIVAnd maps grids is dx=dy=0.125 degrees (around 13.5km and 10.9km accordingly). The vertical resolution is 20 depth levels: [0.,5.,10.,20.,30.,50.,75.,100.,125.,150.,200.,250.,300.,400.,500.,600.,700.,800.,900.,1000.]. The horizontal correlation length is 200km. The vertical correlation length (in meters) was set twices the vertical resolution: [10.,10.,20.,20.,40.,50.,50.,50.,50.,100.,100.,100.,200.,200.,200.,200.,200.,200.,200.,200.]. Duplicates check was performed using the following criteria for space and time: dlon=0.001deg., dlat=0.001deg., ddepth=1m, dtime=1hour, dvalue=0.1. The error variance (epsilon2) was set equal to 1 for profiles and 10 for time series to reduce the influence of close data near the coasts. An anamorphosis transformation was applied to the data (function DIVAnd.Anam.loglin) to avoid unrealistic negative values: threshold value=200. A background analysis field was used for all years (1990-2021) with correlation length equal to 600km and error variance (epsilon2) equal to 20. Quality control of the observations was applied using the interpolated field (QCMETHOD=3). Residuals (differences between the observations and the analysis (interpolated linearly to the location of the observations) were calculated. Observations with residuals outside the minimum and maximum values of the 99% quantile were discarded from the analysis. Originators of Italian data sets-List of contributors: - Brunetti Fabio (OGS) - Cardin Vanessa, Bensi Manuel doi:10.6092/36728450-4296-4e6a-967d-d5b6da55f306 - Cardin Vanessa, Bensi Manuel, Ursella Laura, Siena Giuseppe doi:10.6092/f8e6d18e-f877-4aa5-a983-a03b06ccb987 - Cataletto Bruno (OGS) - Cinzia Comici Cinzia (OGS) - Civitarese Giuseppe (OGS) - DeVittor Cinzia (OGS) - Giani Michele (OGS) - Kovacevic Vedrana (OGS) - Mosetti Renzo (OGS) - Solidoro C.,Beran A.,Cataletto B.,Celussi M.,Cibic T.,Comici C.,Del Negro P.,De Vittor C.,Minocci M.,Monti M.,Fabbro C.,Falconi C.,Franzo A.,Libralato S.,Lipizer M.,Negussanti J.S.,Russel H.,Valli G., doi:10.6092/e5518899-b914-43b0-8139-023718aa63f5 - Celio Massimo (ARPA FVG) - Malaguti Antonella (ENEA) - Fonda Umani Serena (UNITS) - Bignami Francesco (ISAC/CNR) - Boldrini Alfredo (ISMAR/CNR) - Marini Mauro (ISMAR/CNR) - Miserocchi Stefano (ISMAR/CNR) - Zaccone Renata (IAMC/CNR) - Lavezza, R., Dubroca, L. F. C., Ludicone, D., Kress, N., Herut, B., Civitarese, G., Cruzado, A., Lefèvre, D.,Souvermezoglou, E., Yilmaz, A., Tugrul, S., and Ribera d'Alcala, M.: Compilation of quality controlled nutrient profiles from the Mediterranean Sea, doi:10.1594/PANGAEA.771907, 2011.
-

Moving 10-years analysis of chlorophyll-a at Mediterranean Sea for each season : - winter (January-March), - spring (April-June), - summer (July-September), - autumn (October-December). Every year of the time dimension corresponds to the 10-year centered average of each season. Decades span from 1972-1981 until 2006-2015. Observational data span from 1911 to 2015. Depth range (IODE standard depths): -2500.0, -2000.0, -1750.0, -1500.0, -1400.0, -1300.0, -1200.0, -1100.0, -1000.0, -900.0, -800.0, -700.0, -600.0, -500.0, -400.0, -300.0, -250.0, -200.0, -150.0, -125.0, -100.0, -75.0, -50.0, -30.0, -20.0, -10.0, -5.0, -0.0. Data Sources: observational data from SeaDataNet/EMODNet Chemistry Data Network. Description of DIVA analysis: Geostatistical data analysis by DIVA (Data-Interpolating Variational Analysis) tool. Profiles were interpolated at standard depths using weighted parabolic interpolation algorithm (Reiniger and Ross, 1968). GEBCO 1min topography is used for the contouring preparation. Analyzed filed masked using relative error threshold 0.3 and 0.5. DIVA settings: A constant value for signal-to-noise ratio was used equal to 1. Correlation length was optimized and filtered vertically and a seasonally-averaged profile was used. Logarithmic transformation applied to the data prior to the analysis. Background field: the data mean value is subtracted from the data. Detrending of data: no. Advection constraint applied: no. Originators of Italian data sets-List of contributors: o Brunetti Fabio (OGS) o Cardin Vanessa, Bensi Manuel doi:10.6092/36728450-4296-4e6a-967d-d5b6da55f306 o Cardin Vanessa, Bensi Manuel, Ursella Laura, Siena Giuseppe doi:10.6092/f8e6d18e-f877-4aa5-a983-a03b06ccb987 o Cataletto Bruno (OGS) o Cinzia Comici Cinzia (OGS) o Civitarese Giuseppe (OGS) o DeVittor Cinzia (OGS) o Giani Michele (OGS) o Kovacevic Vedrana (OGS) o Mosetti Renzo (OGS) o Solidoro C.,Beran A.,Cataletto B.,Celussi M.,Cibic T.,Comici C.,Del Negro P.,De Vittor C.,Minocci M.,Monti M.,Fabbro C.,Falconi C.,Franzo A.,Libralato S.,Lipizer M.,Negussanti J.S.,Russel H.,Valli G., doi:10.6092/e5518899-b914-43b0-8139-023718aa63f5 o Celio Massimo (ARPA FVG) o Malaguti Antonella (ENEA) o Fonda Umani Serena (UNITS) o Bignami Francesco (ISAC/CNR) o Boldrini Alfredo (ISMAR/CNR) o Marini Mauro (ISMAR/CNR) o Miserocchi Stefano (ISMAR/CNR) o Zaccone Renata (IAMC/CNR) o Lavezza, R., Dubroca, L. F. C., Ludicone, D., Kress, N., Herut, B., Civitarese, G., Cruzado, A., Lefèvre, D., Souvermezoglou, E., Yilmaz, A., Tugrul, S., and Ribera d'Alcala, M.: Compilation of quality controlled nutrient profiles from the Mediterranean Sea, doi:10.1594/PANGAEA.771907, 2011. Units: mg/m^3